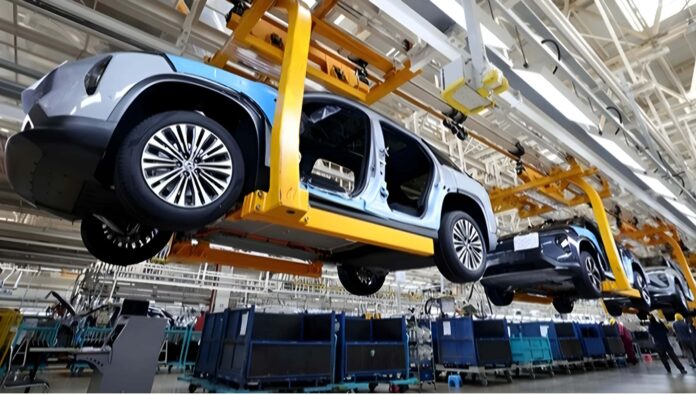
For the first eight months of 2024, the world’s automobile sales were 58.24 million units; specifically, the new energy vehicle (NEV) sales were 9.39 million units, accounting for 16.1% of the total sales. Breaking it down further, pure electric vehicles accounted for 10.4%, while plug-in hybrid vehicles accounted for 5.7%, and hybrid vehicles accounted for 5.6%. During this period, China’s NEV sales accounted for 67% of the global share, of which July to August was as high as 73%. In the pure electric vehicle and plug-in hybrid markets, China’s share has stabilized at 62% and 77%, respectively.
Pure electric vehicle market share
For the global pure electric vehicle market share, China’s share was around 60% in 2017-2018, declined slightly in 2019-2020 in which the share was 48% in 2020, rebounded to 65% in 2022, and reached 62% in 2023. For the first eight months of 2024, the share of 62% was maintained.
| Automaker | 2019 | 2020 | 2021 | 2022 | 2023 | 2024 Q1 | 2024 Q2 | 2024 Q3 |
| BYD | 9.9% | 6.6% | 7.1% | 12.1% | 16.9% | 16.9% | 18.5% | 18.5% |
| Tesla | 20.1% | 23.1% | 23.0% | 20.2% | 21.3% | 23.4% | 18.7% | 18.4% |
| Geely | 3.6% | 2.0% | 2.4% | 5.0% | 5.6% | 7.4% | 7.4% | 8.9% |
| Volkswagen | 4.1% | 10.5% | 8.5% | 5.2% | 7.4% | 6.6% | 6.9% | 6.5% |
| SAIC | 8.2% | 12.9% | 14.6% | 13.3% | 9.2% | 6.1% | 6.5% | 5.5% |
| GAC | 2.8% | 3.1% | 2.7% | 4.0% | 5.1% | 2.6% | 3.2% | 3.7% |
| Nio | 1.4% | 2.2% | 2.0% | 0.0% | 1.7% | 1.5% | 2.3% | 2.5% |
| Changan | 1.9% | 0.9% | 1.7% | 2.7% | 2.2% | 3.1% | 2.9% | 2.3% |
| Chery | 3.1% | 2.2% | 2.2% | 2.9% | 1.3% | 1.7% | 2.8% | 2.2% |
| Leapmotor | – | 0.6% | 1.0% | 1.5% | 1.1% | 1.2% | 1.6% | 2.2% |
| FAW | 1.4% | 0.4% | 0.8% | 1.9% | 1.1% | 1.0% | 1.6% | 1.8% |
In terms of Chinese automaker’s share in the world’s pure electric market, BYD’s share has generally continued to rise. From 2017 to 2021, the overall share level remained above 7%, then rose to 12% in 2022, 17% in 2023, and 18.5% in 2024. Additionally, Geely’s share rose from 4% in 2019 to 8% in 2024.

Plug-in hybrid market share
| Country | 2019 | 2020 | 2021 | 2022 | 2023 | 2024 Q1 | 2024 Q2 | 2024 Q3 |
| China | 41.9% | 24.6% | 32.3% | 55.5% | 68.9% | 69.3% | 77.5% | 82.8% |
| Germany | 9.2% | 25.6% | 18% | 13.2% | 4.4% | 4.0% | 3.1% | 2.6% |
| Japan | 3.0% | 1.3% | 1.3% | 1.4% | 1.3% | 1.9% | 1.1% | 1.1% |
For the global plug-in hybrid market, China’s share ranged from 30% to 50% in 2017-2018, and fell to 25% in 2020. In 2021, China’s share of global plug-in hybrids was 32%, rising to 56% in 2022, and 69% in 2023. From January to August 2024, the share rose to 77%, of which the second quarter reached 78%.
Hybrid market share
| Country | 2019 | 2020 | 2021 | 2022 | 2023 | 2024 Q1 | 2024 Q2 | 2024 Q3 |
| China | 11.9% | 16.5% | 19.4% | 22.5% | 17.5% | 13.6% | 16.2% | 18.2% |
| Germany | 2.1% | 2.5% | 2.5% | 3.1% | 2.6% | 2.6% | 3.2% | 3.6% |
| South Korea | 4.0% | 5.6% | 4.9% | 5.5% | 6.3% | 6.9% | 6.6% | 3.4% |
| Japan | 44.3% | 36.7% | 27.3% | 24.9% | 26.0% | 27.4% | 21.4% | 23.7% |
China’s hybrid market share was climbing from 2019 to 2022, then declining in 2023, and rebounding in Q3 of 2024.
New energy vehicle penetration rate
The global penetration rate of NEVs is generally showing a rapid upward trend, reaching 13% in 2022, 16% in 2023, and low in early 2024, with only 15% in the first quarter, 18.5% in the second quarter, and 16.9% in the first half of the year. For the first eight months of 2024, China’s NEV penetration rate reached 36.4%, Germany reached 16%, Norway reached 60.6%, the United States only 9%, and Japan only 3%.
Source: Cui Dongshu


